Funding Aggregation Report
The Funding Aggregation Report is a Portfolio level report which allows users to compare Simulations from across different Workspaces within the Portfolio. This report provides visualization of the capital funding across their Asset portfolio, and allows users to better understand how different funding levels impact the overall condition and their maintenance budget.
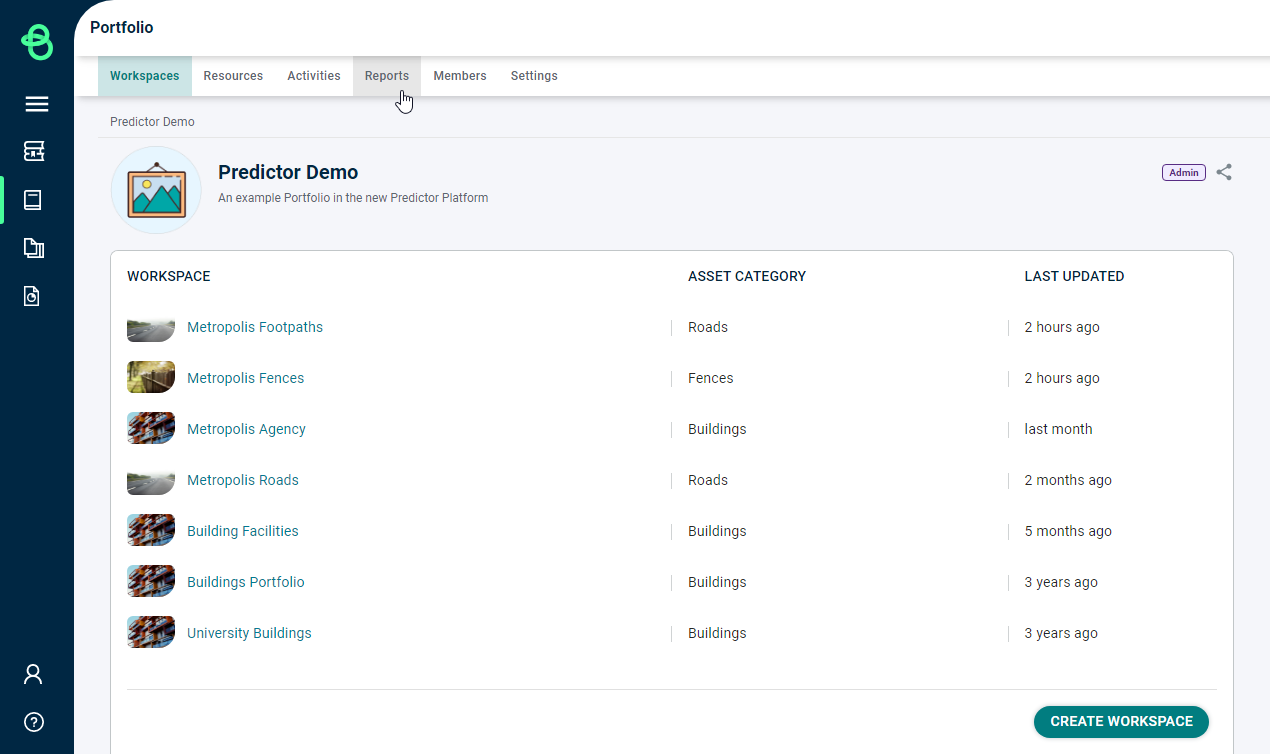
To launch the Funding Aggregation Report, users first open their Portfolio, then select the 'Reports' tab at the top.
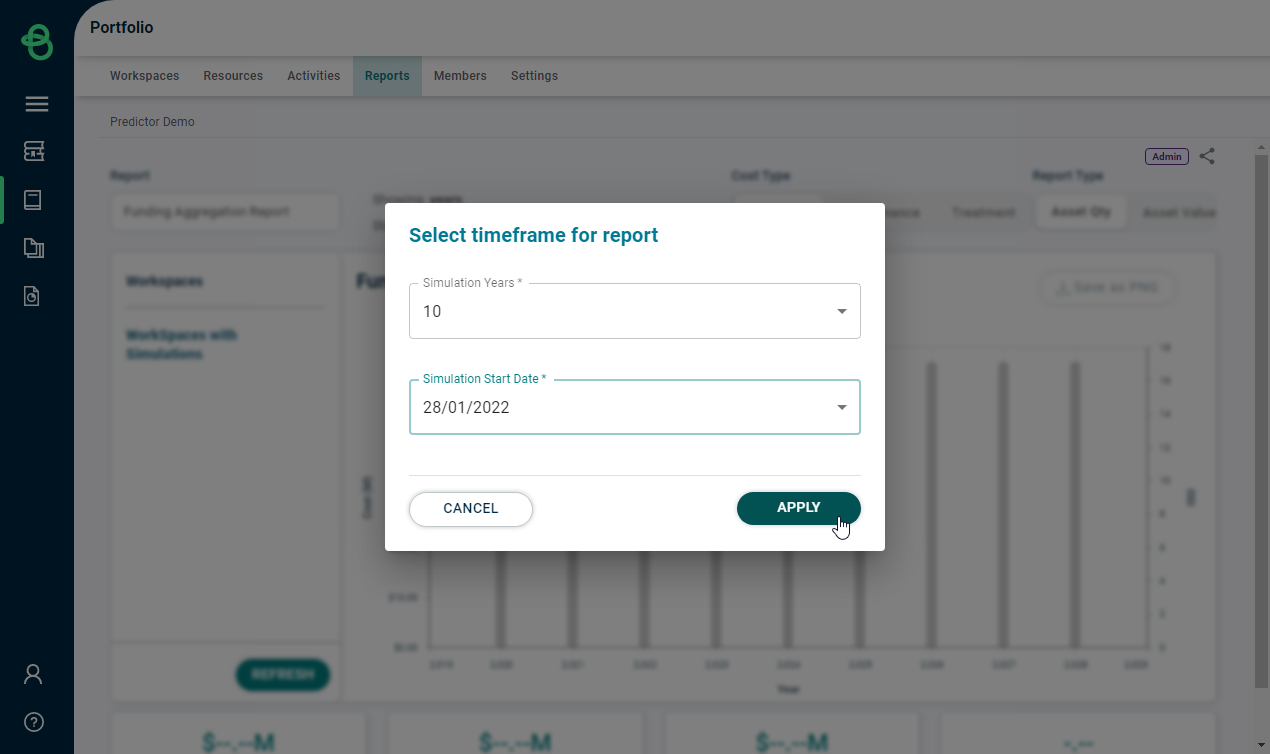
This will then open the Funding Aggregation Report. When launching the report for the first time, users will be prompted to select a timeframe for the report, specifying a duration and a start date. The options available are based on the simulation lengths and start dates from the various simulations in Workspaces within the Portfolio.
Once the the report is loaded, Simulations which have the matching timeframe can be selected from the 'Workspaces' side-panel, and then users can select 'Refresh' to include those Simulations in the report.
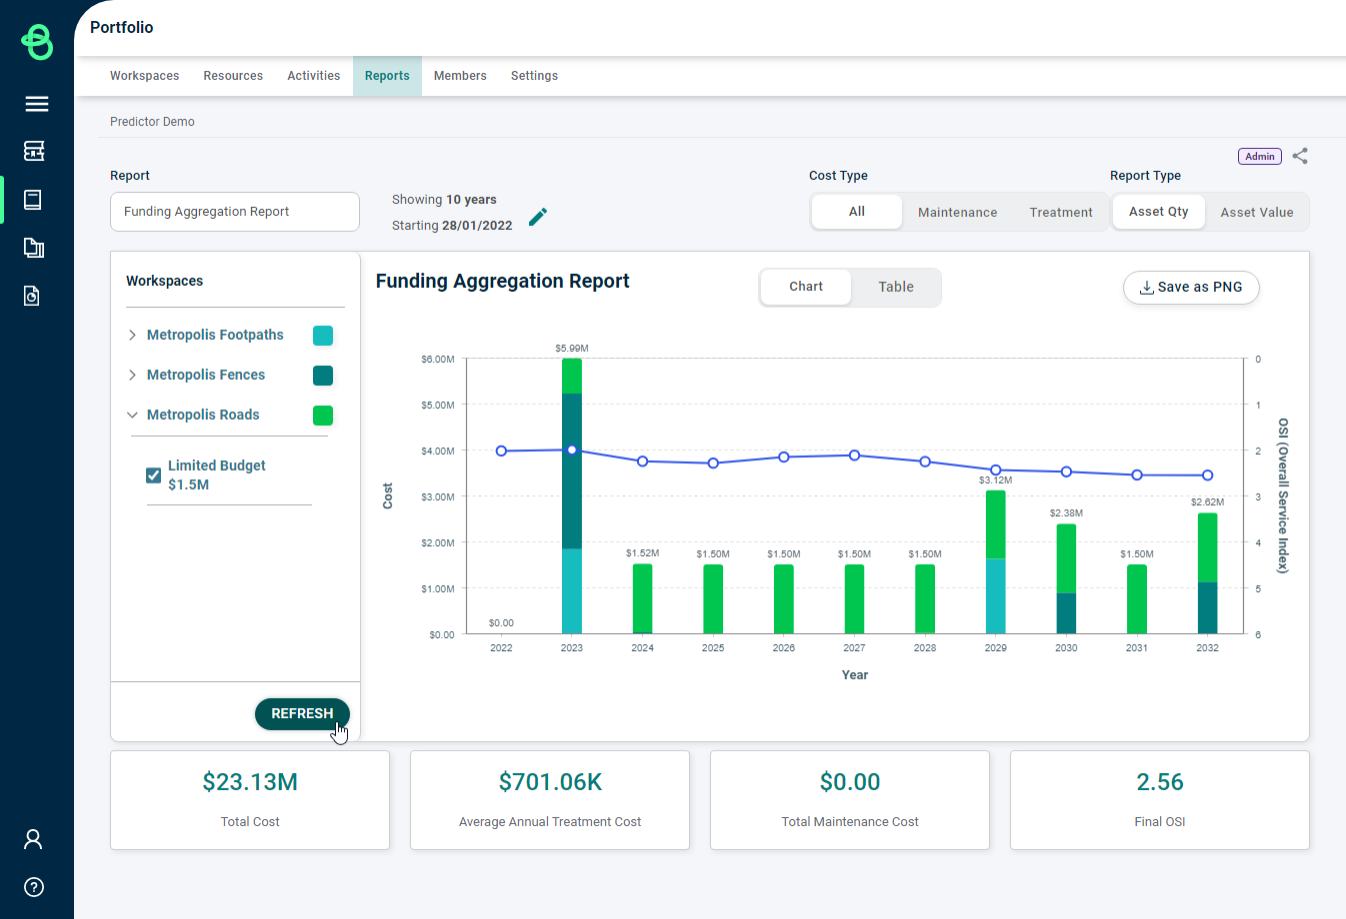
Users are then able to further adjust the viewing options with the various toggles, allowing them to filter the report based on the different Cost Types, change the report to be based on Asset Value or Asset Quantity, and view the report in a chart or a table.
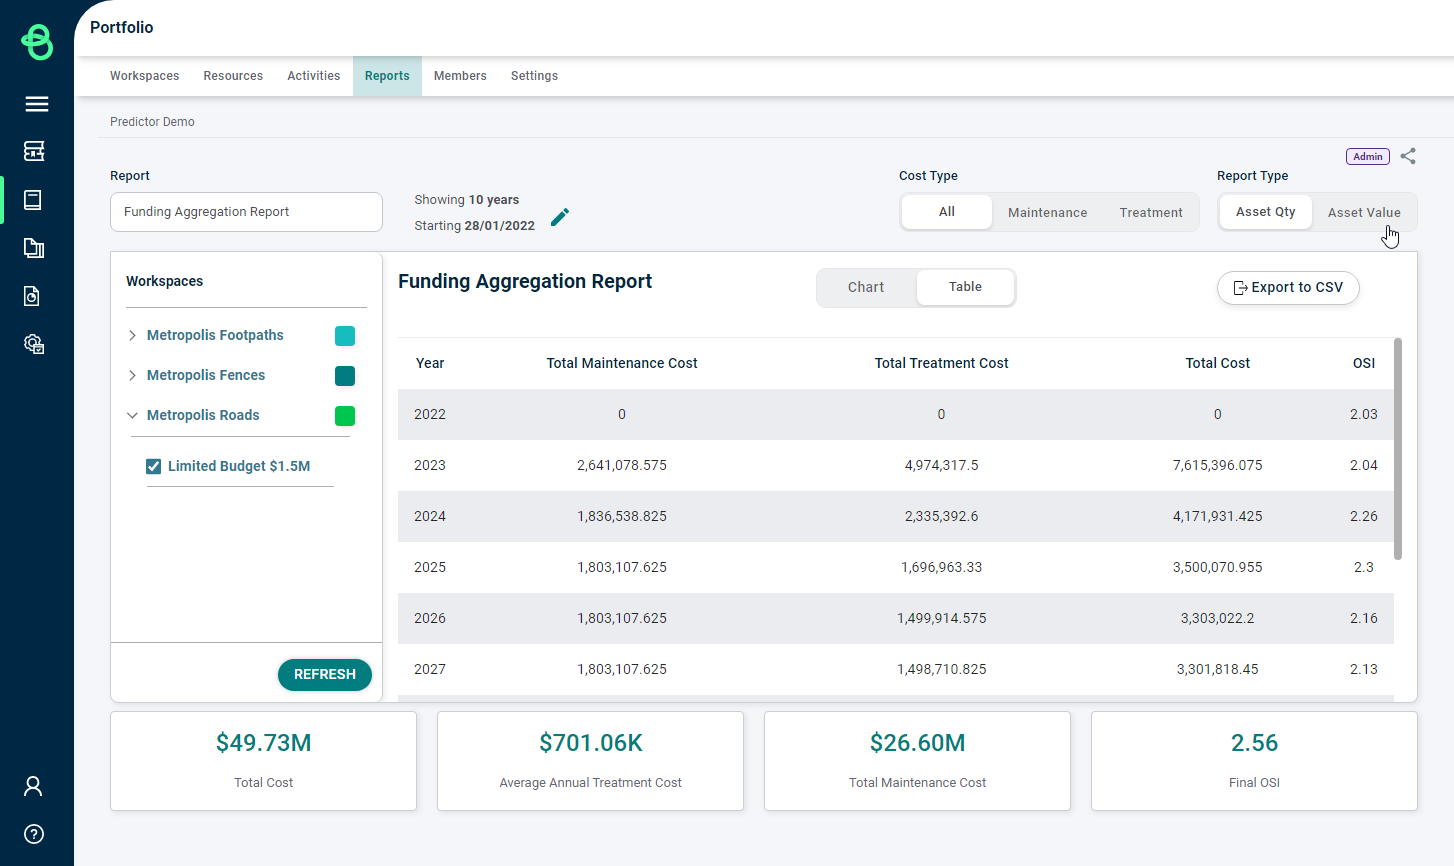
Users are also able to export the chart or table. For additional information about the reporting available at a Workspace level, please see the Reports section.
